Ocean Discovery delivers precision data through photogrammetry. Results are geo-referenced, measurable 3D models ready for analysis, documentation, and visualization — immediately usable by engineers, archaeologists, and decision-makers.
How underwater photogrammetry works
3D scanning with photogrammetry means collecting thousands of overlapping high-resolution still images and processing them into a measurable 3D model. Underwater, the method provides the level of detail needed to understand both the overall site and small technical details such as damage, deformation, free spans, structures, wreck parts, and objects that are difficult to assess visually.
3D scanning of a hazardous wreckPhotogrammetric wreck-site documentationWreck model from photogrammetryDetail from underwater inspectionPhotogrammetric survey3D model side viewPhotogrammetric model
ROV-based data collection
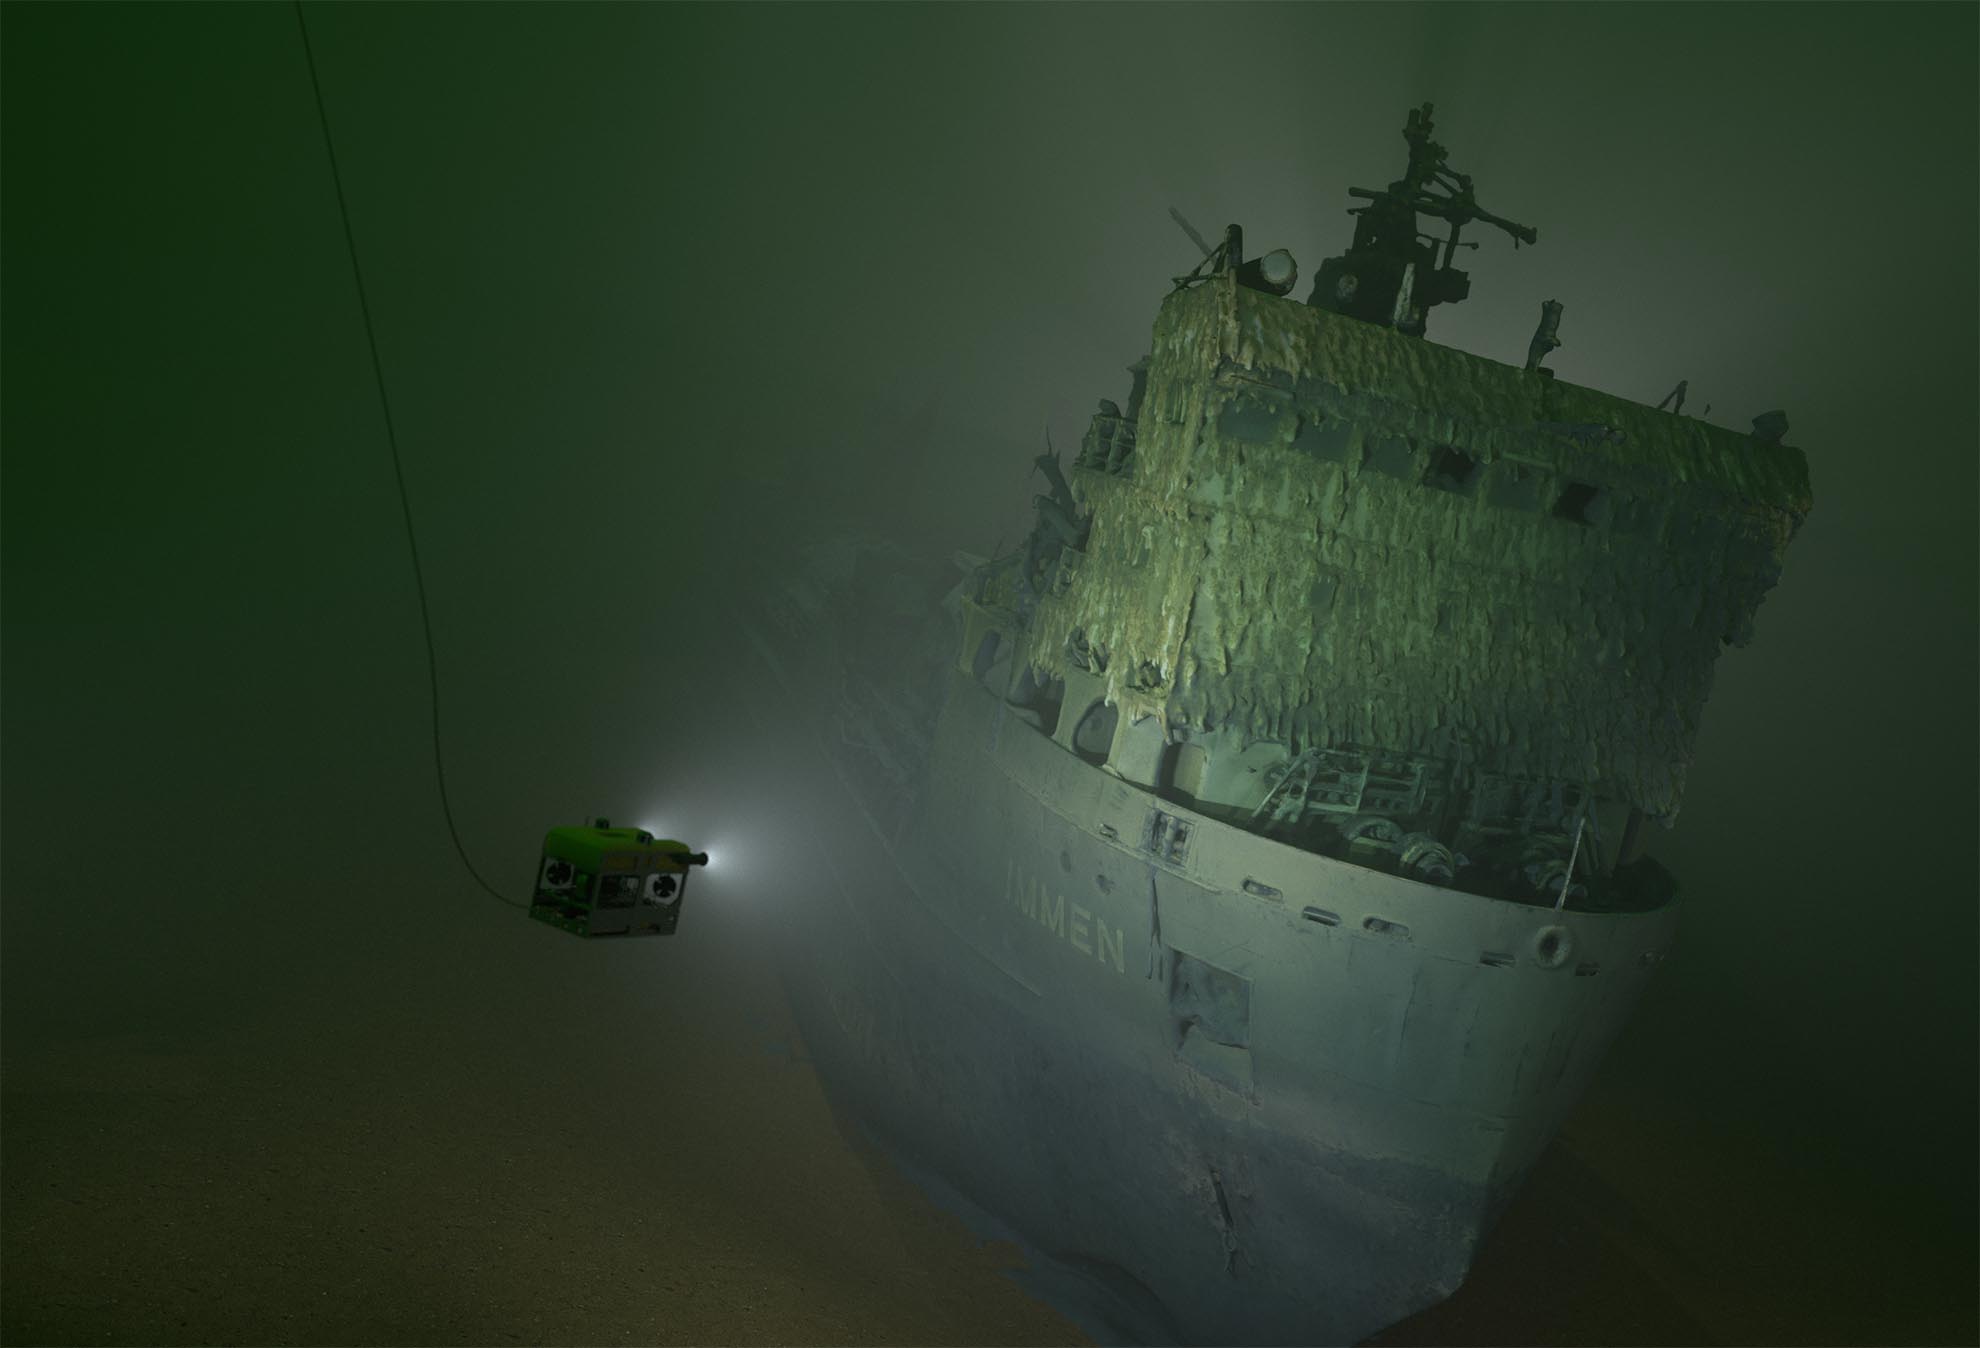
Ocean Discovery uses remotely operated vehicles equipped with high-resolution cameras, powerful lighting, and positioning systems. This makes the work safer and more cost-efficient than diver-based documentation, especially at depth, in poor visibility, or in complex environments. The ROV can collect data systematically over large areas while documenting details that must be measured and reviewed afterwards.
ROV with camera and lightingROV and side scan sonar aboard Ocean Discovery's survey vessel OttoROV-based photogrammetryROV control roomROV equipped with photogrammetry camera and LED strobes
Orthophotos, elevation models, and GIS deliverables
The results can be used directly in analysis and decision-making. The 3D model can be viewed from any angle, supplemented with orthophotos, elevation models, and geo-referenced deliverables, and opened in GIS or 3D software for measurement, analysis, and visualization. In larger projects, orthophotos may combine thousands of images into a single high-resolution overview where every point can be linked to position and measurement data.
Orthographic GIS mosaicDetailed elevation model / DEMPipeline elevation model
Wrecks, ports, pipelines, and infrastructure
The method is used for documenting shipwrecks and environmentally hazardous wrecks, marine archaeological surveys, port inspections, bridge foundations, quays, sheet piling, underwater pipelines, and other submerged structures. It is also useful for accident investigations and visual deliverables for museums, media, and film production, where 3D data can be processed further into CGI, animations, and clear presentations.
Harbour sheet piling and quay in 3DSubsea pipeline and free spanROV inspection of harbour and sheet piling